
")
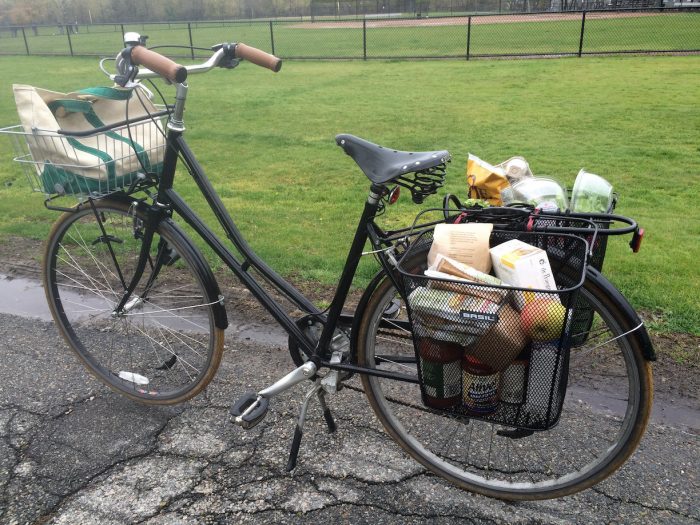
It has always been a core commitment of Cambridge Bike Safety to promote and support local businesses. In fact, those who use bicycles for transportation and shopping have more difficulty accessing big box stores, and are more dependent on thriving local businesses. A common fear among business owners is that the loss of parking that sometimes comes with the construction of protected bike lanes will mean fewer customers and reduced sales. However, in cities around the world, the data has shown that overall, bike lanes have a neutral or even positive effect on business sales, even when there is some parking loss.
How do people travel to commercial districts in Cambridge?
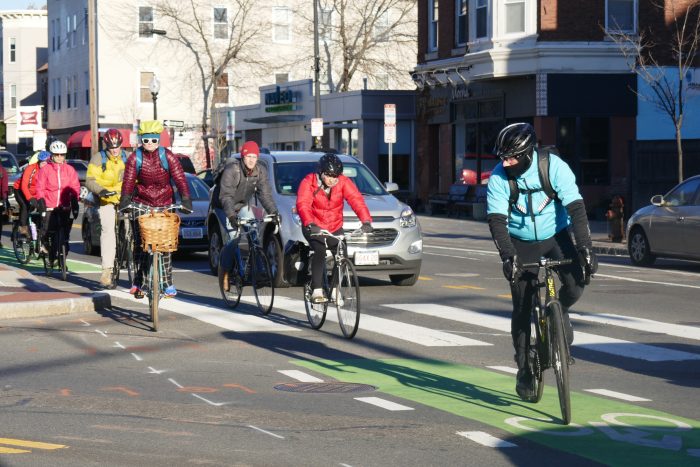
The Cambridge Community Development Department (CDD) regularly conducts street intercept surveys in the business squares, asking customers how they traveled to the square and what changes would make it more appealing for them to shop at the square. Consistently, less than a third of customers travel to the business squares by car (driving alone, carpooling, or via rideshare/taxi) The majority arrive by foot, bike, or transit.

Note: Table was updated on 2/6/2022 to fix an error in data entry. For Porter Square, 16% of people reported biking, not 19%, and 35% of people reported taking the MBTA, not 16%.
As part of these street intercept surveys, both customers and business owners are asked what sorts of changes would make the square more attractive and appealing. Interestingly, these surveys show a dichotomy between these groups. While increased parking is often in the top 3 list of things business owners think would draw more customers (e.g. 70% of business owners in Porter Square, 55% of business owners in Central Square), with the exception of the Inman Square survey, parking doesn’t make it into the top 3 things customers say would bring them to the square more frequently (at Inman Square, 12% of customers surveyed said access and parking would make them shop more). Instead, customers talk about wanting a better mix of retail, more affordable options, special events, and improved street safety infrastructure, including intersection design, bike infrastructure, and sidewalks.
But do cyclists spend money at local businesses?
Cities across the United States and around the world have seen increases in the number of cyclists after safe cycling infrastructure is installed. A Bloomberg article from 2015 highlights 12 studies that looked at the economic impact of bike safety infrastructure, and consistently found that bike lanes have at worst little to no impact on businesses, and in many cases actually increase spending at local businesses.
A recent peer-reviewed article by Volker and Handy, published in 2021, reviewed the relevant literature and found 23 studies in the US and Canada which either (1) quantified and compared consumer spending between active travellers (cyclists, pedestrians) and automobile users, or (2) quantified direct economic impacts to local businesses (sales or sales tax revenues, number of customers, etc.) following the installation of bicycle or pedestrian facilities. In aggregate, these studies similarly found active travel facilities generally had a positive or non-significant economic impact on retail and food service businesses. Eight studies comparing visitor spending by travel mode found that cyclists and pedestrians generally spend similar amounts or more per month in commercial areas compared to visitors who arrive by car or transit. Fifteen studies, assessing 45 unique active travel facilities, examined economic indicators before and after active travel facilities were installed, and/or comparing to nearby sites without active travel facilities. Those studies, again, found non-significant or positive economic impacts on local retail and food service businesses, even in cases where vehicular travel lanes or on-street parking spaces were reduced. There is however some evidence, from three studies focused on corridors in San Francisco, that cycling facilities might dampen sales for auto-centric businesses, such as auto parts or repair shops, gas stations, and large home-goods stores.
Below are two specific case studies, one of a bike lane in Toronto, Canada, and a summary of four separate bicycle and transit infrastructure projects from New York City. Retail sales before and after the infrastructure project, and with neighboring control sites without infrastructure changes, were compared.
Bloor St, Toronto, Canada
In August 2016, the city of Toronto (Canada) launched a pilot project along 1.5 miles of Bloor St West, a busy corridor, carrying approximately 24,000 vehicles and 3,300 cyclists per day. Due to its location and east-west connectivity, Bloor Street was one of the busiest cycling corridors in Toronto, despite not having cycling facilities, and with an average of 22 collisions involving cyclists per year, the corridor was a documented safety concern. As part of the pilot project, 136 on-street parking spaces were removed to build a curbside bike lane. Baseline data was collected in June 2016, with follow-up data collection in October 2016 and June 2017.
With installation of the bike lane, average daily cyclist volumes increased by 49% in June 2017, compared to June 2016. 85% of cyclists surveyed reported feeling safe or very safe riding on Bloor Street after the bike lane installation, compared to only 3% before the installation. Interestingly, motorists also reported feeling safer, with 66% of respondents reporting feeling comfortable driving next to cyclists before the bike lane installation, compared to only 14% before. 86% of pedestrians reported their experience walking on Bloor St was about the same or better than before the bike lane was installed. In consultation with local businesses, the city established loading zones either on Bloor St or on adjacent side streets, and modified the bike lane in the section next to the Royal Ontario Museum to accommodate a designated pick-up/drop-off area for museum events.
To look at the economic impact of the Bloor St West bike lane, researchers from the University of Toronto and the Toronto Center for Active Transportation conducted surveys of merchants and visitors before and after the bike lane installation, which focused on spending, customer counts, visit frequency, and store vacancies. Additionally they conducted surveys along Danforth Avenue, another commercial corridor a few miles east of the pilot site, with similar retail properties but no bike lane, which served as a “control” area. Surveys were conducted in 2015, before the bike lane was installed, and 2017, after the bike lane was installed. The surveys found that:
- Increased number of visitors on both Bloor St (pilot) and Danforth Ave (control)
- Percent of merchants reporting 100 or more customers on a Saturday grew from 46% to 62% on Bloor St, and from 25% to 81% on Danforth Ave
- Increased frequency of visits on Bloor St, compared to no change on Danforth Ave
- Increase in monthly spending by visitors on both Bloor St and Danforth Ave
- Percent of visitors reported spending at least $100 per month grew from 44% to 53% on Bloor St, and from 57% to 70% on Danforth Avenue
- Similar increase in difficulty finding parking on both Bloor St and Danforth Ave, despite no change in number of parking spaces on Danforth Ave
- Percent of people by car had difficulty finding parking grew from 8% to 33% on Bloor St, and from 14% to 25% on Danforth Ave
- Vacancy rates held study at 7% on Bloor St, and declined from 10% to 7% on Danforth Ave
Additionally, the City of Toronto compared point of sale data to analyze customer spending. They looked at the pilot area on Bloor St, and compared it with three control regions: the surrounding neighborhood, a similar section on Danforth Ave, and all businesses within the City of Toronto. When comparing the year before the bike lane pilot, with the year of the pilot, they found that the transactional volume (or value of customer spending) increased across all areas.
- Bloor St pilot area: 4.45% growth
- Surrounding neighborhood: 3.73% growth
- Danforth Ave: 2.21% growth
- City-wide: 4.96% growth
By economic metrics, after the bike lane was installed, businesses on Bloor St performed similarly or better than the control areas analyzed, even with the removal of parking on the pilot section of Bloor St.
New York City
New York City’s Department of Transportation has conducted studies examining the economic benefits of sustainable streets. In 2012, they released a report where they compared retail sales tax filings, commercial leases and rents, and city-assessed market values along corridors that did or did not have street design changes, such as bike lanes, bus lanes, or traffic flow patterns. They compared retail sales before and after the street changes were implemented, as well as to nearby comparison sites and overall neighborhood or borough trends.

Again, as in Toronto, the businesses on streets that received design improvement, such as protected bike lanes, dedicated bus lanes, performed similarly to or even better than neighborhood and borough-wide comparison sites, suggesting that these design changes have a net neutral to net positive effect on the local economy.
If you build it, they will come
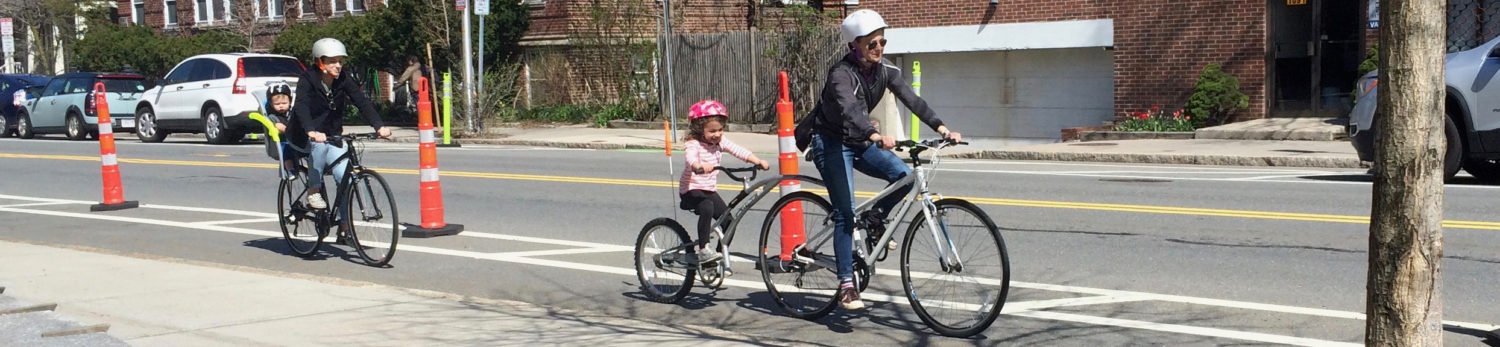
Studies have found that improving active travel infrastructure encourages more people to travel by those modes. Toronto’s Bloor St corridor saw a 49% increase in cyclists after the bike lane was installed. A recent analysis of BlueBike ridership in Boston suggests that bike traffic increased by 80% after a separated bike lane was installed on Commonwealth Avenue.
Closer to home, the City of Cambridge regularly conducts bicycle counts at locations throughout the city. This data can be viewed on the City’s bicycle count data portal. These counts show a steady increase in bicycling, with a fourfold increase in bicyclists between 2002 and 2019. At the same time, scooters, one-wheels, and other wheeled micro-mobility devices have increased in popularity, showing a general shift towards active travel. This increase in the number of people biking correlates with the number of bicycle facility lane miles, which doubled from 46.9 miles in 2004 to 93.7 miles in 2019.
The most common reason people cite as a barrier to biking is safety; in the 2020 Community Needs Survey, 89% of those who do not bike said they do not feel safe riding on Cambridge streets. Specifically, 87% felt unsafe around motor vehicles, and 48% cited poor connections to their intended destinations. On major commercial streets, like Mass Ave, only 25% of all respondents reported feeling “very comfortable” with conventional (i.e. paint only) bicycle lanes. Strikingly, only 4% of people who are “interested but concerned” about biking report feeling “very comfortable” with conventional bicycle lanes. In contrast, 68% of those “interested but concerned” report feeling “very comfortable” on separated bicycle facilities.
Consistently across Cambridge’s business squares, approximately one-third of customers drive, with the majority arriving by foot, bike, or transit. Redesigning our streets to facilitate these modes of travel will help bring more potential customers to our commercial districts.
References
Intercept Studies:
- Central Square Cambridge Commercial District Assessment,Cambridge Community Development Department, Economic Development Division: https://www.cambridgema.gov/-/media/Files/CDD/EconDev/Districts/Central/CentralSquare_DistrictAssessment_2017.pdf
- East Cambridge Customer Intercept Survey Summary Report,Cambridge Community Development Department, Economic Development Division: https://www.cambridgema.gov/-/media/Files/CDD/EconDev/Districts/EastCambridge/eastcamb_2013_survey_final.pdf
- Harvard Square Customer Intercept Survey Report,Cambridge Community Development Department, Economic Development Division: https://www.cambridgema.gov/-/media/Files/CDD/EconDev/Districts/HarvardSq/finalharvardsqsurveyreport_122016.pdf
- Inman Square Customer Intercept Survey Report, Cambridge Community Development Department, Economic Development Division: https://www.cambridgema.gov/-/media/Files/CDD/EconDev/Districts/InmanSq/ed_inmandistrictassessment_012019_2.pdf
- Kendall Square Customer Intercept Survey Summary Report, Cambridge Community Development Department, Economic Development Division: https://www.cambridgema.gov/-/media/Files/CDD/EconDev/Districts/KendallSq/kendallsq_2011_survey.pdf
- Porter Square Lower Mass Ave Cambridge Commercial District Assessment: https://www.cambridgema.gov/-/media/Files/CDD/EconDev/Districts/Porter_NMassAve/portersquarelowermassavedistrictassessment_2020.pdf
Other sources
- Bloor Street West Bike Lane Pilot Project Evaluation: https://www.toronto.ca/legdocs/mmis/2017/pw/bgrd/backgroundfile-107582.pdf
- The Complete Business Case for Converting Street Parking Into Bike Lanes: https://www.bloomberg.com/news/articles/2015-03-13/every-study-ever-conducted-on-the-impact-converting-street-parking-into-bike-lanes-has-on-businesses
- Cambridge Bicycle Plan, Chapter 3: Information and Reporting: https://www.cambridgema.gov/-/media/Files/CDD/Transportation/Bike/bikeplan/2020/finalchaptersjune2021/3informationandreporting_20210618.pdf
- The Economic Benefits of Sustainable Streets, New York City Department of Transportation: http://www.nyc.gov/html/dot/downloads/pdf/dot-economic-benefits-of-sustainable-streets.pdf
- Economic impacts on local businesses of investments in bicycle and pedestrian infrastructure: a review of the evidence: https://www.tandfonline.com/doi/full/10.1080/01441647.2021.1912849
- Research Suggests Boston’s New Protected Lanes Boosted Bikeshare Traffic 80 Percent: https://mass.streetsblog.org/2021/07/22/research-suggests-bostons-new-protected-lanes-boosted-bike-traffic-80-percent/